library(ordPanel)2 Ordered Panel
The R code chunks in Chapter 2 require loading the ordPanel package and executing all R code chunks in Chapter 1,
The example data and statistical analyses presented in Chapter 2 were previously published in a peer-reviewed manuscript by Zezulinski et al. (2025).
NoteData Example
Zezulinski D, Hoteit M, Kaplan D, Simeone A, Zhan T, Doria C, Ahmed F, Roberts L, Block T, Sayeed A (2025). “Detection of circulating mRNA variants in hepatocellular carcinoma patients using targeted RNAseq.” Liver Cancer. ISSN 2235-1795. doi:10.1159/000545366 https://doi.org/10.1159/000545366.
The creation of an ordered panel of variant-signatures should be described in a peer-reviewed manuscript as Tip 2.1.
Tip 2.1: Ordered Panel
An ordered panel of variant-signatures is constructed using a small training cohort, typically comprising fewer than 50 <positive> and 50 <negative> <subjects>. The procedure consists of the following steps:
- Exclude the signatures that identify none of the
<positive.subjects>(e.g., Listing 2.1) in the training cohort; - Exclude the signatures that identify
1-or-more<negative.subjects>(e.g., Listing 2.1) in the training cohort; - Sort the remaining signatures by the number of
<positive.subjects>identified in the training cohort, from most to least; - Sequentially retain variant-signatures such that each retained signature identifies at least one additional
<positive.subjects>beyond the cumulative total identified by all preceding signatures.
These steps are summarized in a flow chart (e.g., Figure 2.1). The decision rule of an ordered panel is straightforward: a new subject is classified as positive if at least one included variant-signature is present.
An ordered panel facilitates the selection of an ordered sub-panel. Specifically, an investigator may reduce the size of an ordered-panel by retaining the variant-signatures at the top of the ordered-panel and excluding those at the bottom. The true- and false-positive rates in the training cohort are summarized both for individual signature and for each possible ordered sub-panel selected by an investigator (e.g., Table 2.1).
The ordered-panel framework and methodology are implemented in the ordPanel package (Zhan (2026), v0.1.1) for R version 4.6.0 (2026-04-24) (R Core Team 2026).
2.1 False(+) ≤0 per Signature
Listing 2.1 creates an ordered panel of variant-signatures (Section 1.2) controlled at zero false positive per signature using the following steps.
- The first call to the function
subset()(Section 5.4) selects the signatures that identify at least one positive subjects in the training cohort (Section 5.3). - The second call to the function
subset()selects the signatures that identify none of the negative subjects in the training cohort (Section 5.3). - The third call to the function
sort_by()(Section 5.5) sorts the signatures by the number of positive subjects identified in the training cohort (Section 5.3), indecreasingorder. - The final call to the function
subset()sequentially retains variant-signatures such that each retained signature identifies at least one additional positive subjects beyond the cumulative total identified by all preceding signatures (Section 5.6).
p0 = m |>
  subset(subset = sum1 > 0L) |>
  subset(subset = sum0 <= 0L, append.label = TRUE) |>
  sort_by(y = ~ sum1, decreasing = TRUE) |>
  subset(subset = diff(cumsum1) > 0L)
p0
# Signature False(+) ≤0/31
# Panel of 23 Variant-Signatures from
# 50 positive subjects
# 31 negative subjects
Figure 2.1 (Listing 2.2) presents a flow chart illustrating the creation of the ordered panel Listing 2.1.
p0 |>
  plot()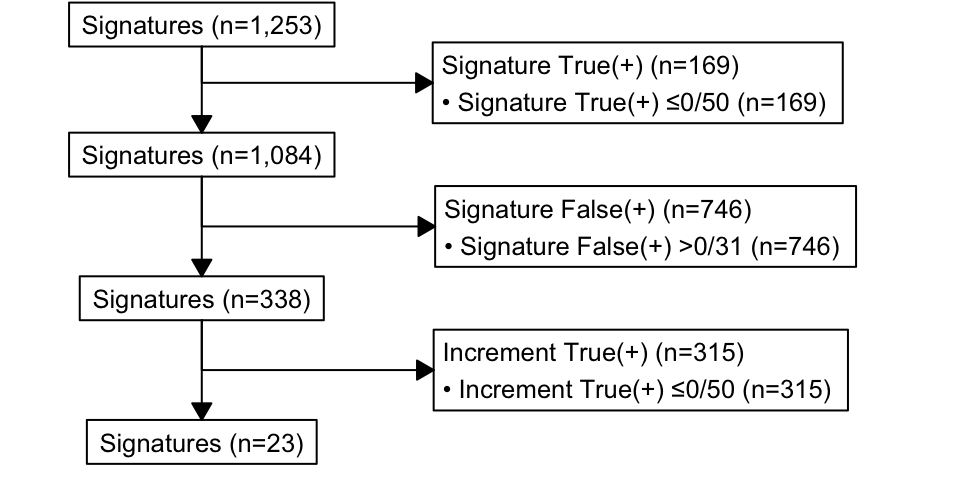
Table 2.1 (Listing 2.3) displays the variant-signatures included in the ordered panel Listing 2.1 and summarizes the true- and false- positive rates for each individual signature, as well as for each ordered sub-panel selected by an investigator. Variant-signatures that include more than one variant are highlighted in light-yellow color.
p0 |>
flextable::as_flextable()Variant-Signature | Variant(s) in Signature | Individual Signature | Ordered Sub-Panel | ||
|---|---|---|---|---|---|
True(+) | False(+) | Sub-Panel True(+) | Sub-Panel False(+) | ||
Signature 1 | chr17:7176997 C>T | 12/50 | 0/31 | 24.0% =12/50 | 0.0% =0/31 |
Signature 2 | chr11:118583356 G>A | 10/50 | 0/31 | 42.0% =21/50 | 0.0% =0/31 |
Signature 3 | chr12:49269877 C>T | 6/50 | 0/31 | 46.0% =23/50 | 0.0% =0/31 |
Signature 4 | chr11:102350873 T>A | 5/50 | 0/31 | 50.0% =25/50 | 0.0% =0/31 |
Signature 5 | chr3:9789723 C>T | 5/50 | 0/31 | 58.0% =29/50 | 0.0% =0/31 |
Signature 6 | chrX:47199344 G>A | 5/50 | 0/31 | 60.0% =30/50 | 0.0% =0/31 |
Signature 7 | chr1:29053204 TA>T | 4/50 | 0/31 | 64.0% =32/50 | 0.0% =0/31 |
Signature 8 | chr1:29053290 C>A | 4/50 | 0/31 | 66.0% =33/50 | 0.0% =0/31 |
Signature 11 | chr17:7313221 G>A | 4/50 | 0/31 | 68.0% =34/50 | 0.0% =0/31 |
Signature 12 | chr19:10115113 C>T | 4/50 | 0/31 | 70.0% =35/50 | 0.0% =0/31 |
Signature 13 | chr19:10252243 G>T | 4/50 | 0/31 | 74.0% =37/50 | 0.0% =0/31 |
Signature 14 | chr19:10252358 G>C | 4/50 | 0/31 | 76.0% =38/50 | 0.0% =0/31 |
Signature 17 | chr19:55092500 C>T | 4/50 | 0/31 | 78.0% =39/50 | 0.0% =0/31 |
Signature 19 | chr5:141583561 T>A | 4/50 | 0/31 | 80.0% =40/50 | 0.0% =0/31 |
Signature 20 | chr8:144098748 A>T | 4/50 | 0/31 | 82.0% =41/50 | 0.0% =0/31 |
Signature 22 | chr1:11054996 C>A | 3/50 | 0/31 | 84.0% =42/50 | 0.0% =0/31 |
Signature 23 | chr1:160999732 C>T | 3/50 | 0/31 | 86.0% =43/50 | 0.0% =0/31 |
Signature 31 | chr11:64800903 A>C | 3/50 | 0/31 | 90.0% =45/50 | 0.0% =0/31 |
Signature 32 | chr12:8946388 C>G | 3/50 | 0/31 | 92.0% =46/50 | 0.0% =0/31 |
Signature 33 | chr14:105249697 C>T | 3/50 | 0/31 | 94.0% =47/50 | 0.0% =0/31 |
Signature 37 | chr16:71921451 A>C | 3/50 | 0/31 | 96.0% =48/50 | 0.0% =0/31 |
Signature 50 | chr19:12747525 C>A | 3/50 | 0/31 | 98.0% =49/50 | 0.0% =0/31 |
Signature 57 | chr19:58551755 G>A | 3/50 | 0/31 | 100.0% =50/50 | 0.0% =0/31 |
2.2 False(+) ≤1 per Signature
Listing 2.4 creates an ordered panel controlled at one or fewer false positive per signature using the same procedure described above.
p1 = m |>
  subset(subset = sum1 > 0L) |>
  subset(subset = sum0 <= 1L, append.label = TRUE) |>
  sort_by(y = ~ sum1, decreasing = TRUE) |>
  subset(subset = diff(cumsum1) > 0L)
p1
# Signature False(+) ≤1/31
# Panel of 18 Variant-Signatures from
# 50 positive subjects
# 31 negative subjects
Figure 2.2 (Listing 2.5) presents a flow chart illustrating the creation of the ordered panel Listing 2.4.
p1 |>
  plot()
Table 2.2 (Listing 2.6) displays the variant-signatures in the ordered panel Listing 2.4 and summarizes the true- and false- positive rates for each individual signature, as well as for each ordered sub-panel selected by an investigator.
p1 |>
flextable::as_flextable()Variant-Signature | Variant(s) in Signature | Individual Signature | Ordered Sub-Panel | ||
|---|---|---|---|---|---|
True(+) | False(+) | Sub-Panel True(+) | Sub-Panel False(+) | ||
Signature 1 | chr17:7176997 C>T | 12/50 | 0/31 | 24.0% =12/50 | 0.0% =0/31 |
Signature 340 | chr18:51196776 G>C | 12/50 | 1/31 | 40.0% =20/50 | 3.2% =1/31 |
Signature 2 | chr11:118583356 G>A | 10/50 | 0/31 | 56.0% =28/50 | 3.2% =1/31 |
Signature 341 | chr5:141582348 C>G | 8/50 | 1/31 | 66.0% =33/50 | 6.5% =2/31 |
Signature 342 | chr17:43015806 C>T | 7/50 | 1/31 | 72.0% =36/50 | 9.7% =3/31 |
Signature 343 | chr19:1080497 C>A | 7/50 | 1/31 | 74.0% =37/50 | 9.7% =3/31 |
Signature 5 | chr3:9789723 C>T | 5/50 | 0/31 | 78.0% =39/50 | 9.7% =3/31 |
Signature 346 | chr19:38840293 C>T | 5/50 | 1/31 | 80.0% =40/50 | 12.9% =4/31 |
Signature 7 | chr1:29053204 TA>T | 4/50 | 0/31 | 82.0% =41/50 | 12.9% =4/31 |
Signature 8 | chr1:29053290 C>A | 4/50 | 0/31 | 84.0% =42/50 | 12.9% =4/31 |
Signature 11 | chr17:7313221 G>A | 4/50 | 0/31 | 86.0% =43/50 | 12.9% =4/31 |
Signature 14 | chr19:10252358 G>C | 4/50 | 0/31 | 88.0% =44/50 | 12.9% =4/31 |
Signature 17 | chr19:55092500 C>T | 4/50 | 0/31 | 90.0% =45/50 | 12.9% =4/31 |
Signature 348 | chr1:12001541 C>T | 4/50 | 1/31 | 92.0% =46/50 | 16.1% =5/31 |
Signature 349 | chr10:17693290 A>AA | 4/50 | 1/31 | 94.0% =47/50 | 19.4% =6/31 |
Signature 350 | chr11:118583892 C>A | 4/50 | 1/31 | 96.0% =48/50 | 22.6% =7/31 |
Signature 31 | chr11:64800903 A>C | 3/50 | 0/31 | 98.0% =49/50 | 22.6% =7/31 |
Signature 32 | chr12:8946388 C>G | 3/50 | 0/31 | 100.0% =50/50 | 22.6% =7/31 |
2.3 False(+) ≤2 per Signature
Listing 2.7 creates an ordered panel controlled at two or fewer false positive per signature using the same procedure described above.
p2 = m |>
  subset(subset = sum1 > 0L) |>
  subset(subset = sum0 <= 2L, append.label = TRUE) |>
  sort_by(y = ~ sum1, decreasing = TRUE) |>
  subset(subset = diff(cumsum1) > 0L)
p2
# Signature False(+) ≤2/31
# Panel of 17 Variant-Signatures from
# 50 positive subjects
# 31 negative subjects
Figure 2.3 (Listing 2.8) presents a flow chart illustrating the creation of the ordered panel Listing 2.7.
p2 |>
  plot()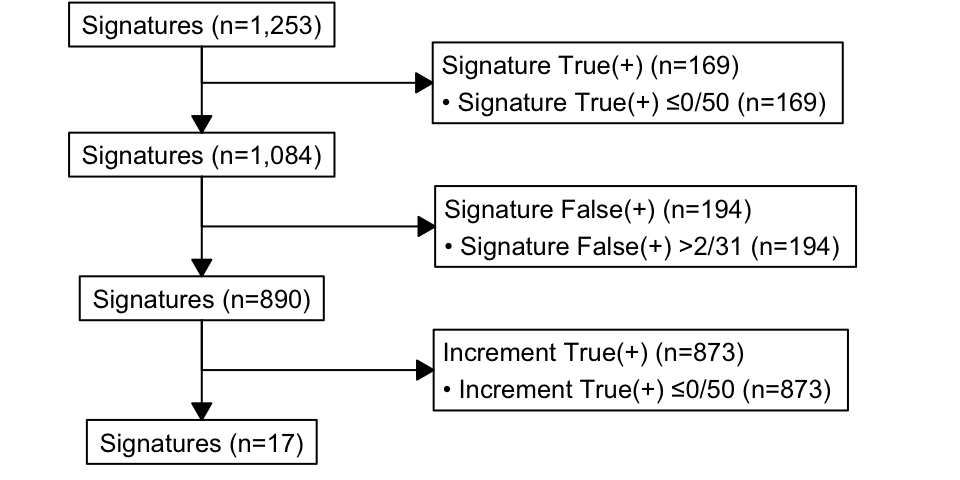
Table 2.3 (Listing 2.9) displays the variant-signatures in the ordered panel Listing 2.7 and summarizes the true- and false- positive rates for each individual signature, as well as for each ordered sub-panel selected by an investigator.
p2 |>
flextable::as_flextable()Variant-Signature | Variant(s) in Signature | Individual Signature | Ordered Sub-Panel | ||
|---|---|---|---|---|---|
True(+) | False(+) | Sub-Panel True(+) | Sub-Panel False(+) | ||
Signature 1 | chr17:7176997 C>T | 12/50 | 0/31 | 24.0% =12/50 | 0.0% =0/31 |
Signature 340 | chr18:51196776 G>C | 12/50 | 1/31 | 40.0% =20/50 | 3.2% =1/31 |
Signature 815 | chr17:50094891 GAGGAT>G | 11/50 | 2/31 | 52.0% =26/50 | 9.7% =3/31 |
Signature 2 | chr11:118583356 G>A | 10/50 | 0/31 | 62.0% =31/50 | 9.7% =3/31 |
Signature 341 | chr5:141582348 C>G | 8/50 | 1/31 | 72.0% =36/50 | 12.9% =4/31 |
Signature 816 | chrX:154442587 T>A | 8/50 | 2/31 | 74.0% =37/50 | 16.1% =5/31 |
Signature 342 | chr17:43015806 C>T | 7/50 | 1/31 | 78.0% =39/50 | 19.4% =6/31 |
Signature 343 | chr19:1080497 C>A | 7/50 | 1/31 | 80.0% =40/50 | 19.4% =6/31 |
Signature 817 | chr17:1651476 A>G | 7/50 | 2/31 | 82.0% =41/50 | 25.8% =8/31 |
Signature 819 | chr21:44856223 C>T | 7/50 | 2/31 | 84.0% =42/50 | 29.0% =9/31 |
Signature 5 | chr3:9789723 C>T | 5/50 | 0/31 | 88.0% =44/50 | 29.0% =9/31 |
Signature 346 | chr19:38840293 C>T | 5/50 | 1/31 | 90.0% =45/50 | 32.3% =10/31 |
Signature 827 | chr7:64978289 G>A | 5/50 | 2/31 | 92.0% =46/50 | 38.7% =12/31 |
Signature 14 | chr19:10252358 G>C | 4/50 | 0/31 | 94.0% =47/50 | 38.7% =12/31 |
Signature 17 | chr19:55092500 C>T | 4/50 | 0/31 | 96.0% =48/50 | 38.7% =12/31 |
Signature 349 | chr10:17693290 A>AA | 4/50 | 1/31 | 98.0% =49/50 | 41.9% =13/31 |
Signature 32 | chr12:8946388 C>G | 3/50 | 0/31 | 100.0% =50/50 | 41.9% =13/31 |
2.4 False(+) ≤3 per Signature
Listing 2.10 creates an ordered panel controlled at three or fewer false positive per signature using the same procedure described above.
p3 = m |>
  subset(subset = sum1 > 0L) |>
  subset(subset = sum0 <= 3L, append.label = TRUE) |>
  sort_by(y = ~ sum1, decreasing = TRUE) |>
  subset(subset = diff(cumsum1) > 0L)
p3
# Signature False(+) ≤3/31
# Panel of 16 Variant-Signatures from
# 50 positive subjects
# 31 negative subjects
Figure 2.4 (Listing 2.11) presents a flow chart illustrating the creation of the ordered panel Listing 2.10.
p3 |>
  plot()
Table 2.4 (Listing 2.12) displays the variant-signatures in the ordered panel Listing 2.10 and summarizes the true- and false- positive rates for each individual signature, as well as for each ordered sub-panel selected by an investigator.
p3 |>
flextable::as_flextable()Variant-Signature | Variant(s) in Signature | Individual Signature | Ordered Sub-Panel | ||
|---|---|---|---|---|---|
True(+) | False(+) | Sub-Panel True(+) | Sub-Panel False(+) | ||
Signature 1 | chr17:7176997 C>T | 12/50 | 0/31 | 24.0% =12/50 | 0.0% =0/31 |
Signature 340 | chr18:51196776 G>C | 12/50 | 1/31 | 40.0% =20/50 | 3.2% =1/31 |
Signature 815 | chr17:50094891 GAGGAT>G | 11/50 | 2/31 | 52.0% =26/50 | 9.7% =3/31 |
Signature 1042 | chr13:45516236 A>G | 11/50 | 3/31 | 64.0% =32/50 | 16.1% =5/31 |
Signature 2 | chr11:118583356 G>A | 10/50 | 0/31 | 70.0% =35/50 | 16.1% =5/31 |
Signature 341 | chr5:141582348 C>G | 8/50 | 1/31 | 76.0% =38/50 | 19.4% =6/31 |
Signature 816 | chrX:154442587 T>A | 8/50 | 2/31 | 78.0% =39/50 | 22.6% =7/31 |
Signature 1043 | chr16:71922614 C>A | 8/50 | 3/31 | 80.0% =40/50 | 29.0% =9/31 |
Signature 342 | chr17:43015806 C>T | 7/50 | 1/31 | 84.0% =42/50 | 29.0% =9/31 |
Signature 343 | chr19:1080497 C>A | 7/50 | 1/31 | 86.0% =43/50 | 29.0% =9/31 |
Signature 819 | chr21:44856223 C>T | 7/50 | 2/31 | 88.0% =44/50 | 29.0% =9/31 |
Signature 1045 | chr16:2037561 G>A | 7/50 | 3/31 | 90.0% =45/50 | 32.3% =10/31 |
Signature 5 | chr3:9789723 C>T | 5/50 | 0/31 | 94.0% =47/50 | 32.3% =10/31 |
Signature 827 | chr7:64978289 G>A | 5/50 | 2/31 | 96.0% =48/50 | 38.7% =12/31 |
Signature 17 | chr19:55092500 C>T | 4/50 | 0/31 | 98.0% =49/50 | 38.7% =12/31 |
Signature 349 | chr10:17693290 A>AA | 4/50 | 1/31 | 100.0% =50/50 | 38.7% =12/31 |