3 Operating Characteristics
The R code chunks in Chapter 3 require loading the ordPanel package and executing all R code chunks in Chapter 1 and Chapter 2,
library(ordPanel)The example data and statistical analyses presented in Chapter 3 were previously published in a peer-reviewed manuscript by Zezulinski et al. (2025).
Zezulinski D, Hoteit M, Kaplan D, Simeone A, Zhan T, Doria C, Ahmed F, Roberts L, Block T, Sayeed A (2025). “Detection of circulating mRNA variants in hepatocellular carcinoma patients using targeted RNAseq.” Liver Cancer. ISSN 2235-1795. doi:10.1159/000545366 https://doi.org/10.1159/000545366.
The operating characteristics of ordered panel(s) should be described in a peer-reviewed manuscript as Tip 3.1.
The operating characteristic curves (e.g., Figure 3.1) of one-or-more ordered panels of variant-signatures have the horizontal axis of the number of variant-signatures included in each ordered sub-panel selected by an investigator; and the vertical axis of the percentage of <positive.subjects> identified in the training cohort, that is, the sensitivity-in-training-cohort. An operating characteristics curve that approaches the upper-left corner indicates better performance, corresponding to higher sensitivity-in-training-cohort achieved with fewer variant-signatures in the selected ordered sub-panel.
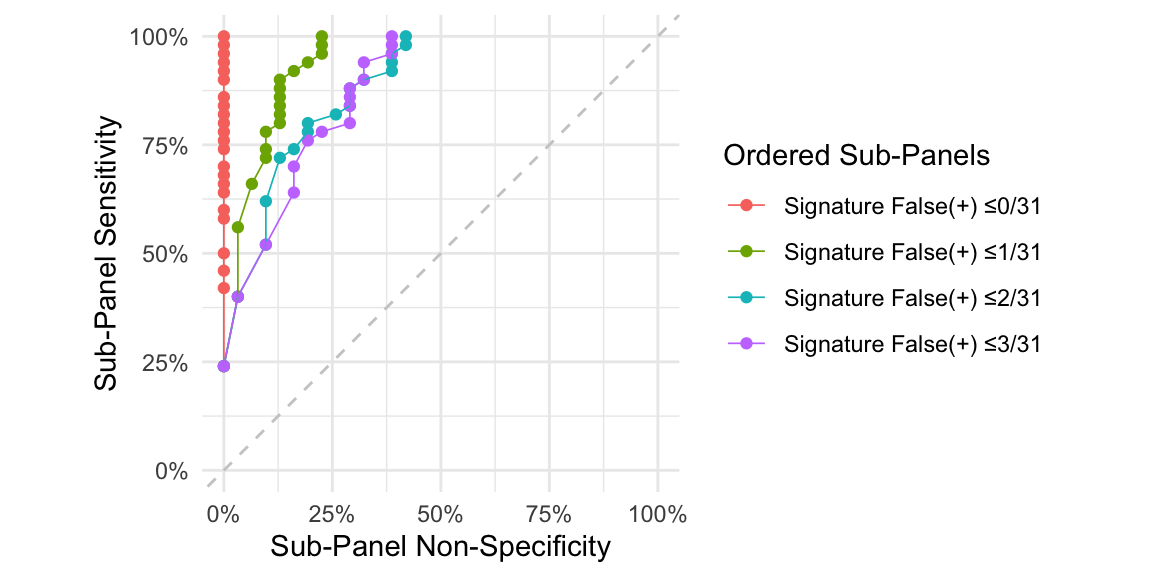
The pseudo receiver operating characteristic (ROC) curves (e.g., Figure 3.2) of one-or-more ordered panels of variant-signatures have the horizontal and vertical axes representing the non-specificity and sensitivity in the training cohort, respectively, of each ordered sub-panel selected by an investigator. These curves are referred to as pseudo ROC curves because each sensitivity–non-specificity pair (1) is defined in the training cohort alone; (2) corresponds to a particular ordered sub-panel, rather than to a continuously varying decision threshold on a classifier scoring function.
The ordered-panel framework and methodology are implemented in the ordPanel package (Zhan (2026), v0.1.1) for R version 4.6.0 (2026-04-24) (R Core Team 2026).
3.1 Ordered Panel List
Listing 3.1 constructs an ordered panel list (Chapter 6) by combining the ordered panels Listing 2.1, Listing 2.4, Listing 2.7, Listing 2.10.
(z = panellist(p0, p1, p2, p3))
# Component 1 :
# Signature False(+) ≤0/31
# Panel of 23 Variant-Signatures from
# 50 positive subjects
# 31 negative subjects
#
# Component 2 :
# Signature False(+) ≤1/31
# Panel of 18 Variant-Signatures from
# 50 positive subjects
# 31 negative subjects
#
# Component 3 :
# Signature False(+) ≤2/31
# Panel of 17 Variant-Signatures from
# 50 positive subjects
# 31 negative subjects
#
# Component 4 :
# Signature False(+) ≤3/31
# Panel of 16 Variant-Signatures from
# 50 positive subjects
# 31 negative subjects
3.2 Operating Characteristics
Figure 3.1 (Listing 3.2) and Figure 3.2 (Listing 3.3) visualize the operating characteristic curves and the pseudo receiver operating characteristic (ROC) curves, respectively, of the ordered panel-list in Listing 3.1. Among the four ordered panels, the ordered panel controlled at a per-signature false-positive rate of ≤1/31 (Listing 2.4) may be considered optimal.
Compared with the ordered panel Listing 2.4,
- the ordered panel controlled at a more stringent criterion of per-signature false positive of
≤0/31(Listing 2.1) exhibits- ❌ lower sensitivity for the same number of selected variant-signatures (Figure 3.1);
- ✅ lower non-specificity per ordered sub-panel (Figure 3.2);
- ❌ lower sensitivity for the same number of selected variant-signatures (Figure 3.1);
- the ordered panel and ordered panel controlled at less stringent criteria of per-signature false positive of
≤2/31(Listing 2.7) and≤3/31(Listing 2.10), respectively, exhibit- ❌ similar sensitivity for the same number of selected variant-signatures (Figure 3.1);
- ❌ higher non-specificity per ordered sub-panel (Figure 3.2).
z |>
  ggplot2::autoplot() +
  ggplot2::theme_minimal()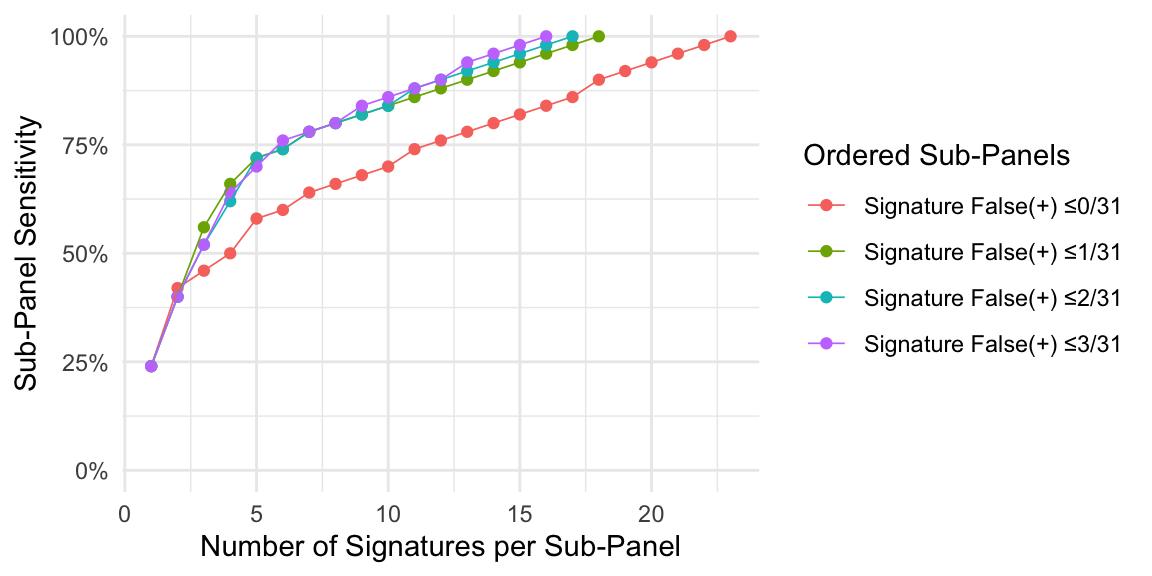
z |>
  ggplot2::autoplot(which = 'roc') +
  ggplot2::theme_minimal()