library(ordPanel)5 panel
The R code chunks in Chapter 5 require loading the ordPanel package,
The example data and statistical analyses presented in Chapter 5 were previously published in a peer-reviewed manuscript by Zezulinski et al. (2025).
NoteData Example
Zezulinski D, Hoteit M, Kaplan D, Simeone A, Zhan T, Doria C, Ahmed F, Roberts L, Block T, Sayeed A (2025). “Detection of circulating mRNA variants in hepatocellular carcinoma patients using targeted RNAseq.” Liver Cancer. ISSN 2235-1795. doi:10.1159/000545366 https://doi.org/10.1159/000545366.
5.1 An S4 Class 'panel'
The function panel() (Chapter 1) creates an R object of S4 class 'panel', with slots
@m1, alogicalmatrix, variant-signatures on the rows and positive subjects on the columns (Listing 5.1)@m0, alogicalmatrix, variant-signatures on the rows and negative subjects on the columns (Listing 5.2)@id, alistofcharactervectors. Eachcharactervectorcontains the variants in a signature (Listing 1.7)@label, an optionalcharacterscalar
@m1 of S4 class 'panel' (Listing 1.5) (Zezulinski et al. 2025)
m@m1 |>
  head(n = c(3L, 3L))
#                UPH-106P UPH-004P UPH-083P
# Signature    1    FALSE    FALSE     TRUE
# Signature    2    FALSE    FALSE    FALSE
# Signature 3 FALSE FALSE TRUE@m0 of S4 class 'panel' (Listing 1.5) (Zezulinski et al. 2025)
m@m0 |>
  head(n = c(3L, 3L))
#                UPC-022P UPC-021P UPC-044P
# Signature    1    FALSE    FALSE    FALSE
# Signature    2    FALSE    FALSE    FALSE
# Signature    3    FALSE    FALSE    FALSE
5.2 Display
The S4 method of show prints the vital information, e.g., the number of signatures, and the number of positive and negative subjects, of an S4 'panel' object (Listing 1.5).
5.3 True & False Positives
The function sum1() and sum0() find the number of true- and false-positives per signature in a panel, respectively.
Listing 5.3 and Listing 5.4 find the number of true- and false-positives per signature in the panel Listing 1.5.
m |>
  sum1() |>
  head(n = 3L)
# Signature    1 Signature    2 Signature    3
# 12 10 6m |>
sum0() |>
head(n = 3L)
# Signature 1 Signature 2 Signature 3
# 0 0 05.4 Subset
The S3 method subset.panel() 🚧
5.4.1 By Panel-Wise False Positives
The ordered panel Listing 2.4 controlled at one-or-less false positive per signature has a substantial false positive rate per ordered sub-panel (Table 2.2).
Listing 5.5 imposes an additional criterion on false positive per ordered sub-panel.
p1a = p1 |>
  subset(subset = cumsum0 <= 4L)
p1a
# Signature False(+) ≤1/31
# Panel of 13 Variant-Signatures from
# 50 positive subjects
# 31 negative subjects
Figure 5.1 (Listing 5.6) adds an additional exclusion box to the flow chart Figure 2.2.
p1a |>
  plot()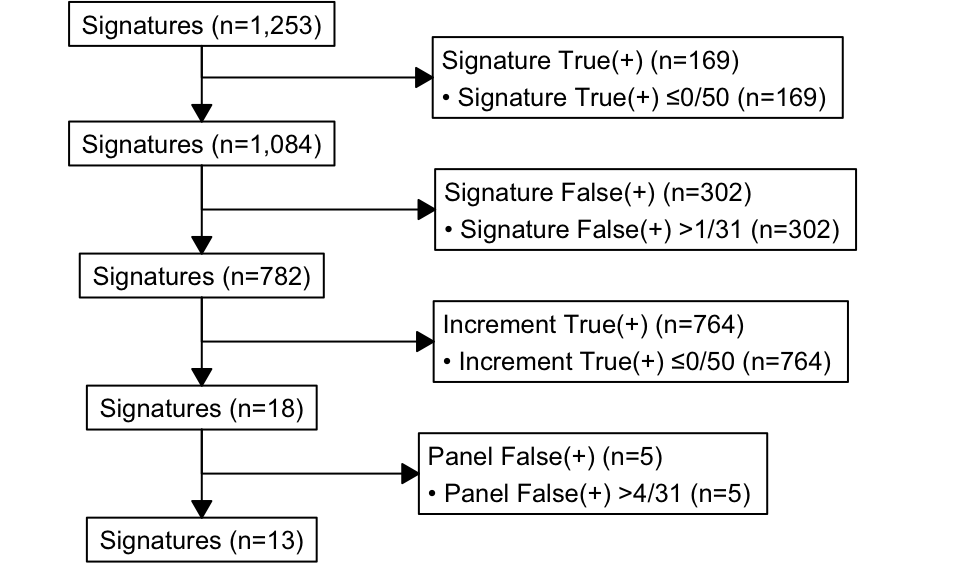
Table 5.1 (Listing 5.7) drops the last few lines of Table 2.2 at the additional criteria on the false positive per ordered panel.
p1a |>
flextable::as_flextable()Variant-Signature | Variant(s) in Signature | Individual Signature | Ordered Sub-Panel | ||
|---|---|---|---|---|---|
True(+) | False(+) | Sub-Panel True(+) | Sub-Panel False(+) | ||
Signature 1 | chr17:7176997 C>T | 12/50 | 0/31 | 24.0% =12/50 | 0.0% =0/31 |
Signature 340 | chr18:51196776 G>C | 12/50 | 1/31 | 40.0% =20/50 | 3.2% =1/31 |
Signature 2 | chr11:118583356 G>A | 10/50 | 0/31 | 56.0% =28/50 | 3.2% =1/31 |
Signature 341 | chr5:141582348 C>G | 8/50 | 1/31 | 66.0% =33/50 | 6.5% =2/31 |
Signature 342 | chr17:43015806 C>T | 7/50 | 1/31 | 72.0% =36/50 | 9.7% =3/31 |
Signature 343 | chr19:1080497 C>A | 7/50 | 1/31 | 74.0% =37/50 | 9.7% =3/31 |
Signature 5 | chr3:9789723 C>T | 5/50 | 0/31 | 78.0% =39/50 | 9.7% =3/31 |
Signature 346 | chr19:38840293 C>T | 5/50 | 1/31 | 80.0% =40/50 | 12.9% =4/31 |
Signature 7 | chr1:29053204 TA>T | 4/50 | 0/31 | 82.0% =41/50 | 12.9% =4/31 |
Signature 8 | chr1:29053290 C>A | 4/50 | 0/31 | 84.0% =42/50 | 12.9% =4/31 |
Signature 11 | chr17:7313221 G>A | 4/50 | 0/31 | 86.0% =43/50 | 12.9% =4/31 |
Signature 14 | chr19:10252358 G>C | 4/50 | 0/31 | 88.0% =44/50 | 12.9% =4/31 |
Signature 17 | chr19:55092500 C>T | 4/50 | 0/31 | 90.0% =45/50 | 12.9% =4/31 |
Figure 5.2 (Listing 5.8) and Figure 5.3 (Listing 5.9) truncate the operating characteristic curve (Figure 3.1) and the pseudo receiver operating characteristic (ROC) curve (Figure 3.2) of the ordered panel Listing 2.4.
panellist(p0, p1a) |>
  ggplot2::autoplot() +
  ggplot2::theme_minimal()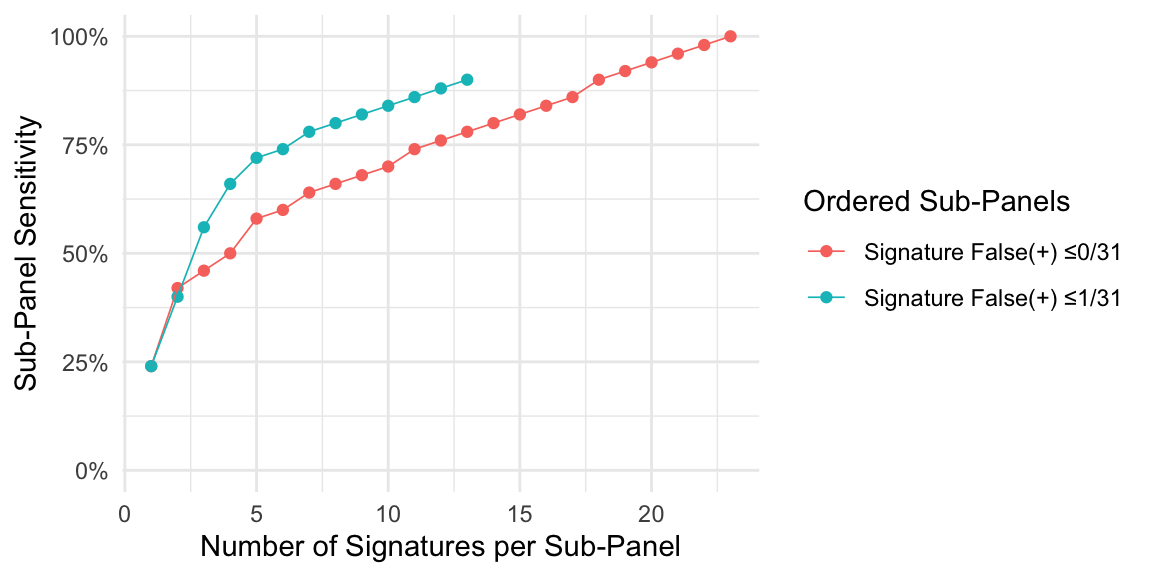
panellist(p0, p1a) |>
  ggplot2::autoplot(which = 'roc') +
  ggplot2::theme_minimal()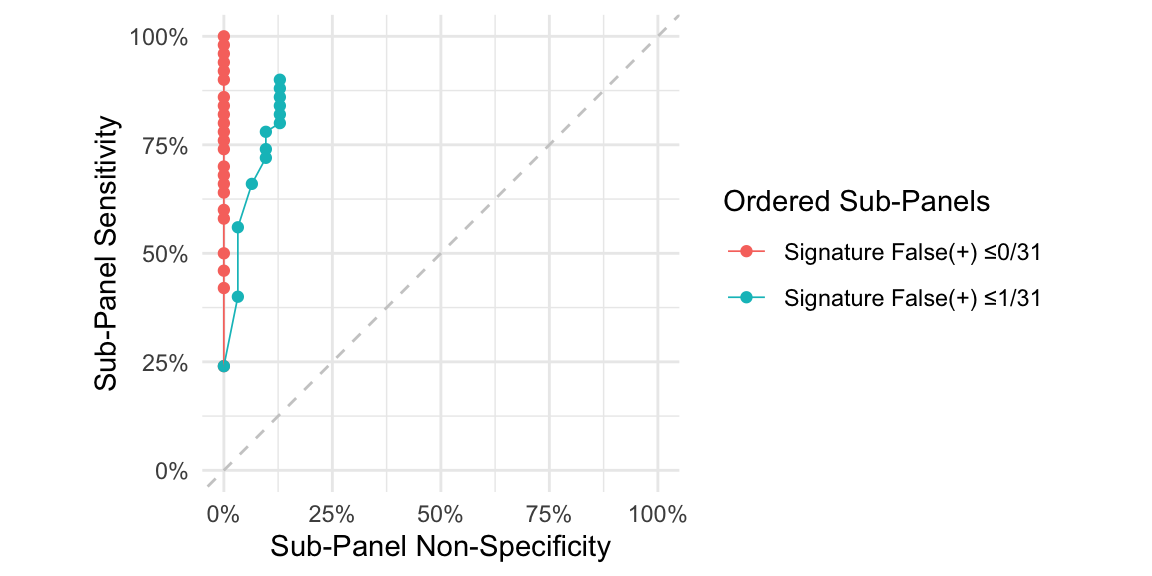
5.5 Sort-By
The S3 method sort_by.panel() 🚧
5.6 Cumulative True & False Positives
The function cumsum1() finds the number of true positives, by a sub-panel of the first \(i\) signatures.
The function cumsum0() finds the number of false positives, by a sub-panel of the first \(i\) signatures.
The function cumsum1() and cumsum0() return a not-strictly increasing integer vector.
# example5.7 Append Label
The function append_label() 🚧
5.8 Flow Chart
The S3 method plot.panel() creates a flow chart of the creation of a panel, using the consort package (Dayim 2024).
The S3 method plot.panel() is a wrapper of the function consort::consort_plot(), which returns an object of class 'consort'.
Examples using the S3 method plot.panel() are provided in Chapter 2.