library(ordPanel)6 panellist
The R code chunks in Chapter 6 require loading the ordPanel package and executing all R code chunks in Chapter 1 and Chapter 2,
The example data and statistical analyses presented in Chapter 5 were previously published in a peer-reviewed manuscript by Zezulinski et al. (2025).
NoteData Example
Zezulinski D, Hoteit M, Kaplan D, Simeone A, Zhan T, Doria C, Ahmed F, Roberts L, Block T, Sayeed A (2025). “Detection of circulating mRNA variants in hepatocellular carcinoma patients using targeted RNAseq.” Liver Cancer. ISSN 2235-1795. doi:10.1159/000545366 https://doi.org/10.1159/000545366.
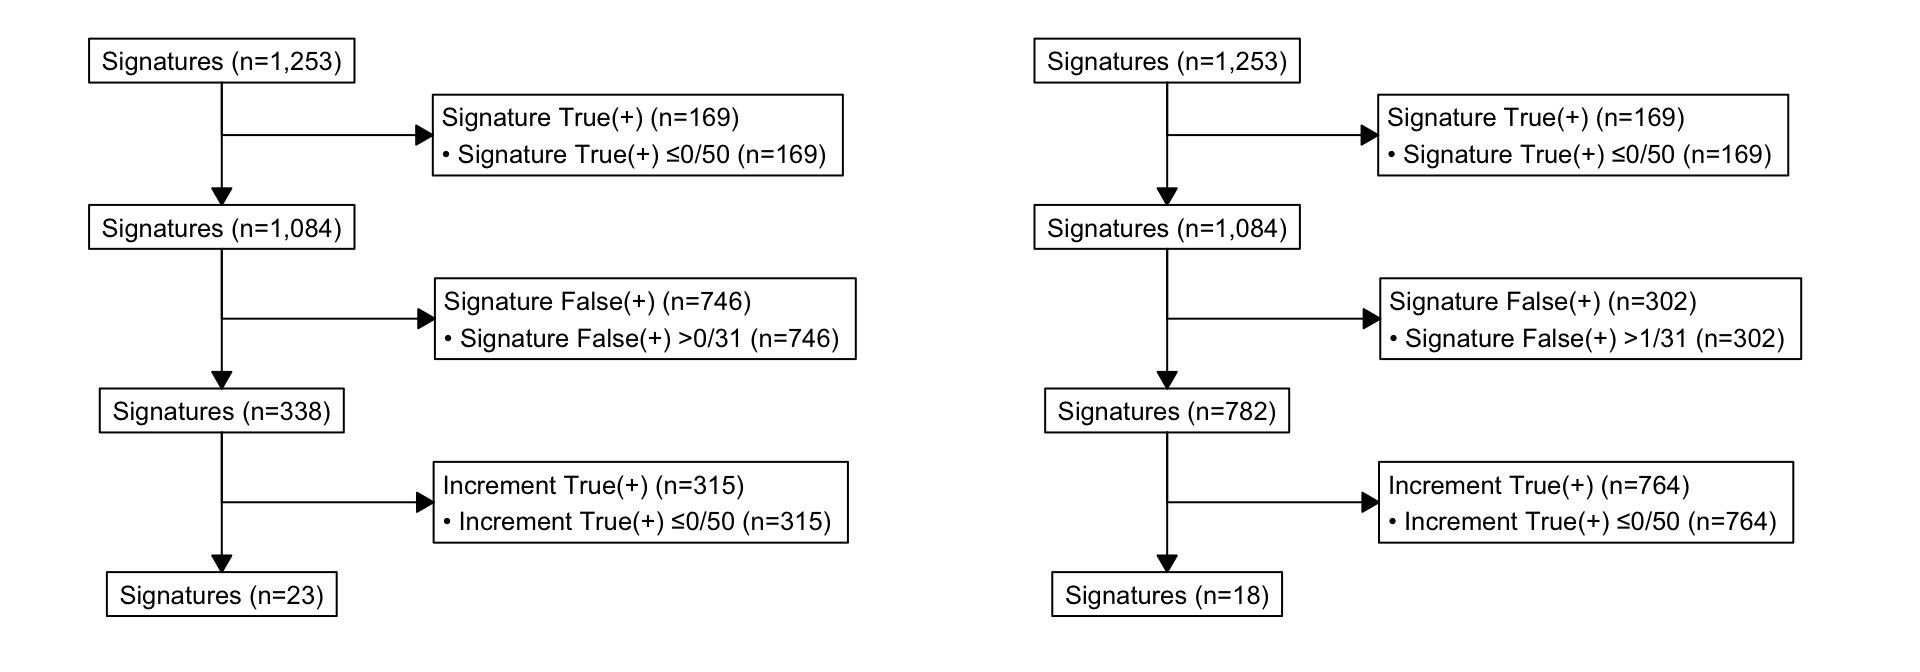
6.1 Flow Chart
The S3 method plot.panellist() organizes the flow charts of each panel member in a panellist in a collage, using the consort (Dayim 2024) and patchwork (Pedersen 2025) packages.
Figure 6.1 (Listing 6.1) presents side-by-side the flow charts of Listing 2.1 (Figure 2.1) and Listing 2.4 (Figure 2.2).
panellist(p0, p1) |>
  plot(nrow = 1L)